Free SQL Health Monitor
- Monitor the performance of all MS SQL Server versions up to MS SQL Server 2014
- Keep a tab on the performance parameters of both default and named instances
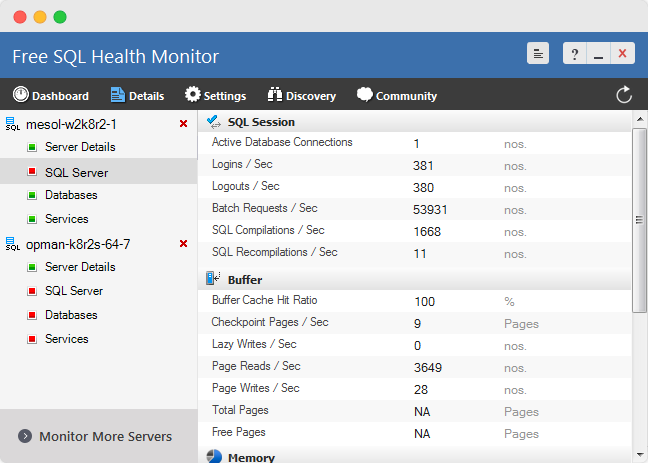
- Get a dashboard view of system resources used & MS SQL performance parameters
- Fetch the status of Winodws services related to your MS SQL Server
- Keep an eye on buffer, memory, lock and latch details of your MS SQL Server
- Generate real time performance reports in PDF format and Email it from the tool